
![]()
Commentary by RHB Global Sukuk Markets Research, Kuala Lumpur, Malaysia
Sukuk return stumbled on Saudi downgrade.
Article Overview
The Bloomberg Malaysia Sukuk Ex-MYR Total Return (BMSXMTR) and Dow Jones Sukuk Total Return (DJSUKTXR) indices ended the week lower at 101.8 (-0.3% w-o-w) and 155.5 (-0.27% w-o-w) respectively. This was driven by Saudi and Turkish FIs names like Saudi Electricity Global Sukuk Co 23-24 (A1/A+/AA-), KT Sukuk Varlk Kiralama AS 16 (NR/NR/BBB) and TF Varlik Kiralama AS 18 (NR/NR/BBB), with market capitalization declining by c.USD78m. Weighted average yield was 5.9bps wider at 2.37% as investors turned bearish on Saudi downgrade and “live possibility” of Fed rate hike in December.
Sukuk Idea
Sukuk: QIIB Sukuk Funding Limited 2.688% 10/17 (YTM: 1.798%; T+98.9bps; Z+90.1bps)
Amount Outstanding: USD700m Sukuk Al Mudaraba
ISIN: XS0843912808
Rating: A2/NR/A; Sta
Relative Value Commentary: We reiterate a preference for QIIK 10/17, last mentioned on 4-Sept, which offers an attractive pick up of 15.9bps over FGBUH 4.046% 1/17 (YTM: 1.639%; T+115.1bps; similar ratings). Furthermore, it is currently trading c.6.5bps wider than its average yield of 1.733% since Moody’s last rating upgrade on 11-May which we think is unwarranted and the gap with FGBUH should be tighter.
Investment Merits:
- High probability of systematic support from Qatari government, given QIA ownership of 17% and solid standing as the leading Islamic bank in Qatar.
- Strong capitalization, with TCE-to-RWA ratio of 20.2% as of Dec-14 in comparison to industry average of 17%.
- Sound but declining asset quality. NPL ratio deteriorated to 1.6% as of Sept-15 from 1.0% as of Dec-14 but still remain in line to Qatari peers of 1.6. The deterioration was due to increased holdings of non-performing financing assets by c.76%.
Investment Risks:
- Sector concentration to real estate, which accounts 38% of its loan book.
- Aggressive credit growth, with loans rising 27% CAGR between 2011 and 2014.
- Margin compression. NIM declined to 3.29% in Sep-15 from 3.40% in 2014, given tough operating environment and tighter liquidity.
Quarterly USD Sukuk Supply (as at 6-Nov-2015)
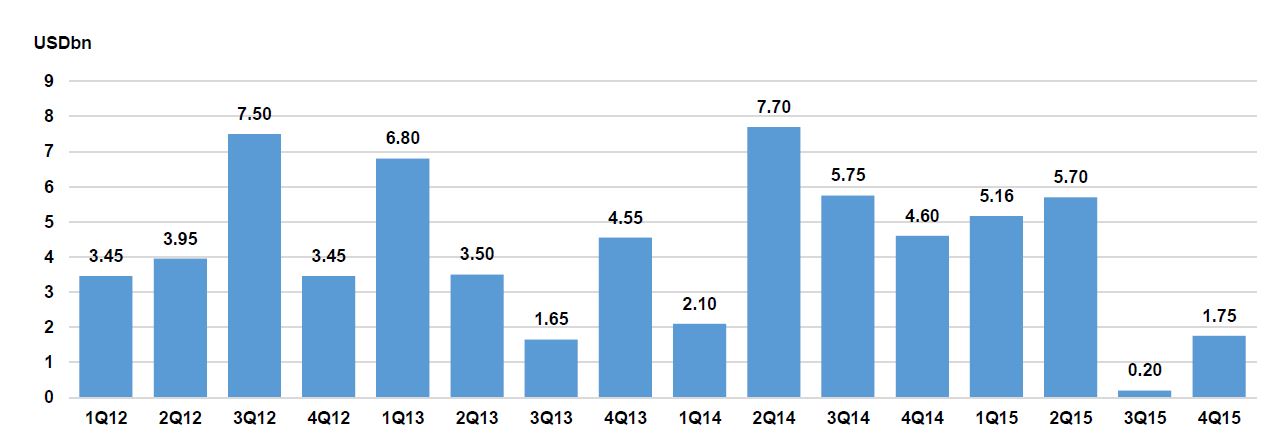
Quarterly USD Sukuk Supply (as at 6-Nov-2015)
Contrastingly, Indonesia and Malaysia’s CDS tightened
The spread for Malaysia and Indonesia’s CDS fallen to 184.7bps (-18.2bps) and 214.1bps (-13.7bps) on the back of the China’s next 5-year growth plan. Separately, Indonesia economy growth held stable at 4.73% in 3Q15 and headline inflation moderated to 6.3%y-o-y in Oct (Sept: 6.8%). Turkey CDS has tightened 8.09bps to 246.4bps on better-than-expected trade balance of -USD3.74bn in Sept (Aug: USD4.9bn) and slower inflation of 7.58% y-o-y in Oct (Sept: 7.95%). Elsewhere, Bahrain (-1.6bps to 322bps), Dubai (-3.0bps to 197bps), Abu Dhabi (-2.3bps to 72.7bps), and Qatar (-2.3bps to 72.7bps) albeit Qatar’s Sept CPI rose to 1.5% y-o-y from 1.2% in Aug.
Cost of insuring Saudi Arabia’s debt hammered by gloomy oil price outlook
Saudi CDS has been on an upward trajectory since mid-Aug following IMF’s projected of a larger fiscal deficit of 19.5% of GDP in 2015 (2014: 3.4% of GDP). Due to S&P’s downgrade on fiscal worries, the CDS rose to its highest level since Jun-09 to 156.3bps on Monday by 21.9bps w-o-w or equivalent to USD102k for every USD10m of Saudi credits. However, the impact to Saudi’s financing costs are expected to be minimal given its low debt level of 1.6% of GDP in 2014 (2015e: 6.7% of GDP; 2016e: 17.3% of GDP). Nonetheless, concerns on near-term fiscal sustainability and economic prospects with estimated real GDP to slow to 3.4% in 2015 and 2.2% in 2016 (2014: 3.5%) would continue weigh on the CDS spreads. There are some similar pattern of CDS movement among countries and hence, we see a possibility of other CDS such as Bahrain and Dubai to widen in tandem with Saudi’s CDS.
Abu Dhabi Islamic Bank (ADIB) – A2/NR/A+; Sta
Larger customer base fueled ADIB’s steady earnings. 3Q15 net profit grew 5.5% y-o-y to AED503.2m as number of customers increased 13.7% to 855,468. The bank’s NPL ratio improved to 4% (2014: 4.4%) of having to simultaneously reducing 1.5% impairment charges and higher loan growth of 5.8% YTD. On the other hand, provision coverage ratio deteriorated to 90% from 95.6% in December but still better off than industry’s 88%. TCE-to-RWA ratio has improved to 8.8% from 8.2% in 2014, but weaker than 14.4% industry average. The improvement in the ratio was driven by the Aug’s right issue of AED504m and higher retained earnings, which had a numerator effect.
RHB View: Neutral. ADIB’s credit to stay defensive in our opinion given its low loans-to-deposits ratio (86.4%) relative to sector’s LDR of 91% and high likelihood of support from UAE government – National holding’s Emirates International Investment Company (EIIC) held 40% of shareholding. However, these were moderated by weak capitalization metrics, high cost-to-income ratio (3Q15: 45.8%; industry average: 36%) and concentration risks. ADIBUH 11/16 was last priced at 1.28% (-13bps).
Emirates Islamic Bank (EIB) NR/NR/A+; Sta
Further improvements in profitability and asset quality. EIB’s net profit surged 109% y-o-y to AED534m on higher financing book receivables and operating income by 24%-27%. Improving asset quality, with NPL and provision coverage ratios standing at 7.6% and 107% in comparison to 10% and 90% in 2014, respectively.